With size comes the expectation of leadership. That may or may not be true in the real world, but it seems true in the stock market. Apple (AAPL) was once a stock market leader and seemed to have significance for the broader market. Times have clearly changed. Everybody is aware of the precipitous fall in Apple's stock price, but a more subtle change has occurred that could be good for the stock. Apple is now #2 in the SPDR S&P 500 ETF (SPY). It lost the top spot to Exxon Mobil (XOM), which comprises 2.93% of the SPY, compared to 2.91% for Apple (as of March 14, 2013). Near its peak, Apple represented 4.44% of the S&P 500 (end of June 2012). In this article, I will discuss some of the implications of Apple's return to normalcy and how it could be a positive catalyst for the stock.
The Apple Selloff
There were lots of reasons for the selloff in Apple's stock price from approximately $700 per share. The failure to meet expectations, margin concerns, questions about the product pipeline, competition from Samsung, capital structure complaints and many other issues weighed down the stock in recent months.
However, an important aspect of investor psychology seems to have been overlooked. During Apple's ascent to $700 per share it represented a larger and larger percentage of the S&P 500. Many mutual funds and other investors try to hug the index to guarantee that their performance does not under-perform by too much. There was an increasing incentive for these investors to buy more shares of Apple and to match the weighting of Apple in their portfolios to the weighting in the S&P 500. Many investors likely bought shares of Apple just because they were underweight Apple, not necessarily based on financial projections or product analysis. The catch-up buying was probably exacerbated by the speed of the move up to $700, which created a cycle of more and more demand for the stock. On top of this, momentum investors had a field day with Apple.
A few months ago I looked at the holdings of a large-cap mutual fund that was supposed to be conservative and saw that it had an ~10% weighting in Apple. Regardless of Apple's prospects, I wondered if a 10% weighting in any stock was really that conservative. How did Apple's weighting get so big? It probably had something to do with the fact that Apple's weighting in the S&P 500 increased so dramatically. Many smart investors made a lot of money investing in Apple for the right reasons, but there was probably a lot of buying for the wrong reasons too.
Now the selloff. If you bought Apple to play catch-up you probably were not the first to sell at $700, but once the selling began you probably played catch-up on the way down too. With Apple's nosedive coinciding with a great period for the S&P 500 and many other stocks, there was even more incentive to sell if you were only there to play the catch-up in the first place.
On June 29, 2012, Apple's weighting in the S&P 500 was 119 bps more than Exxon's weighting (4.44% vs. 3.25%), but now Exxon is ahead by 2 bps and both represent less than 3% of the S&P 500.
Things are a lot more normal now, but is that good or bad?
Apple Is No Longer A Stand-Alone Asset Class
I heard lots of talk during Apple's 2011/2012 rally about Apple becoming its own asset class. Clearly, with the pedestrian rank of #2 in the SPY, Apple no longer deserves that title. So, if Apple is no longer a stand-alone asset class, what could that mean for the stock? Maybe, some more correlation.
Apple's recent decline comes in sharp contrast to the strength in the S&P 500, especially since early December.
(click to enlarge)
(Source: FreeStockCharts.com)
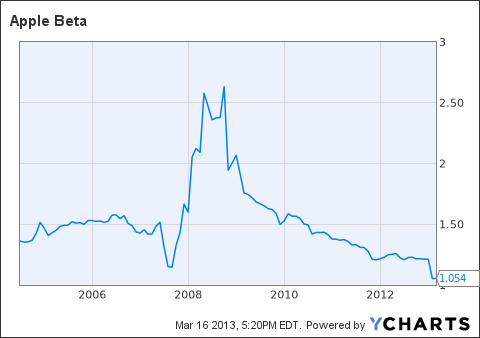
In fact, the long-term trend has been for Apple becoming increasingly correlated to the S&P 500. According to Seeking Alpha, Apple has a 36 month Beta of 0.74 and a 60 month Beta of 1.04.
The following chart shows the long-term trend for Apple's Beta as it has moved closer and closer to 1:

AAPL Beta data by YCharts
Apple's Return To Normalcy Coincides With A Resetting Of Earnings Estimates
Not only has Apple returned to normalcy in terms of its place in the SPY ETF, Apple's management reset earnings expectations. Actually, it reset its approach to giving guidance. Historically, Apple would give extremely conservative guidance estimates that analysts and investors then inflated to come up with their own projections. After a few quarters of performing well relative to guidance, but falling short of expectations, Apple hit the reset button during the last earnings call.
Peter Oppenheimer, Apple's CFO, said in last earnings call (here):
"In addition to the reporting changes that I've already mentioned to further increase transparency into our business we're changing our approach to how we provide guidance. In recent years our guidance reflected a conservative point estimate of results every quarter that we have reasonable confidence in achieving. Going forward we plan to provide a range of guidance that reflects our belief of what we're likely to achieve." (Source: Seeking Alpha)
This new approach was one of the reasons that equity analysts cut their earnings estimates since January.
The following table displays the earnings estimates for Apple over the last three months. Note that the last earnings call was on January 23, so the 60-days-ago numbers were roughly the pre-call estimates. 
(Source: Yahoo Finance)
It remains to be seen how Apple performs relative to the new guidance and how much investors and analysts can trust the new approach. If Apple's guidance proves more useful we may see another manifestation of Apple's return to normalcy, which could be a positive for the company.
Valuation
A more normal Apple that is no longer a stand-alone asset class, has a more traditional market correlation and less volatility in earnings estimates, may start to get credit for its low valuation. Over long periods of time, fundamentals and valuation matter, but anything can happen in the short term. It seems that the "Apple is cheap on a valuation basis" argument has not mattered during Apple's sharp drop from $700 per share, but maybe it could come back soon. Certainly, David Einhorn is doing his best to force Apple to return more cash to shareholders.
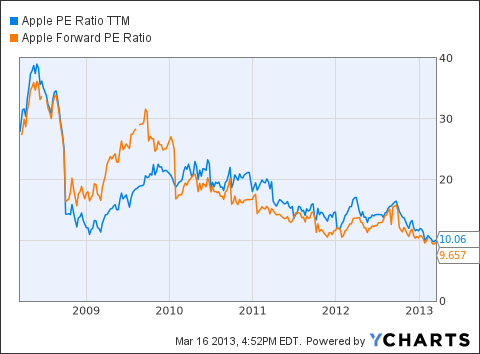
Interestingly, Apple's trailing TTM P/E and forward P/E are below the lows of the 2008/2009 financial crisis. Lots of people are looking at Apple's price chart and trying to find a level where the stock should/could/may put in a low, but maybe the P/E chart can give a better indication.

AAPL PE Ratio TTM data by YCharts
Furthermore, with a growing level of cash per share, over time Apple's P/E multiple ex-cash has decreased even further.
In contrast to Apple's 10.0x and 9.7x trailing and forward P/E multiples, the SPY has a 16.4x and 14.1x trailing and forward P/E multiples.
Conclusions
Apple's era as a stand-alone asset class is over. The beat up and bruised stock is now #2 in the SPY. As the shenanigans on the way up and way down fade away we may see a more normal stock price performance. Apple may become more correlated to the S&P 500 and more predictable in its earnings performance relative to expectations. In such a scenario, maybe Apple's below market valuation and huge cash hoard will soon become catalysts to put the stock back on an upward trajectory.
Risks
Even after the large price drop, Apple still has many risks. Apple faces constant pressure to come up with the next big thing and its rivals are catching up. It may never have revolutionary products like the iPod and iPhone again. Furthermore, Apple faces margin pressures. One could argue that a lot of risk is priced into the stock given its P/E that is below market, but Apple is in an industry that has seen giants fall and disappear, so there are no guarantees that it can continue to innovate and sell its products.
Disclaimer
The opinions expressed above should not be construed as investment advice. This article is not tailored to specific investment objectives. Reliance on this information for the purpose of buying the securities to which this information relates may expose a person to significant risk. The information contained in this article is not intended to make any offer, inducement, invitation or commitment to purchase, subscribe to, provide or sell any securities, service or product or to provide any recommendations on which one should rely for financial, securities, investment or other advice or to take any decision. Readers are encouraged to seek individual advice from their personal, financial, legal and other advisers before making any investment or financial decisions or purchasing any financial, securities or investment related service or product.
Information provided, whether charts or any other statements regarding market, real estate or other financial information, is obtained from sources which we and our suppliers believe reliable, but we do not warrant or guarantee the timeliness or accuracy of this information. Nothing in this article should be interpreted to state or imply that past results are an indication of future performance.
THERE ARE NO WARRANTIES EXPRESSED OR IMPLIED AS TO ACCURACY, TIMELINESS, COMPLETENESS, OR RESULTS OBTAINED FROM ANY INFORMATION IN THIS ARTICLE OR ANY LINKED WEBSITE.
Disclosure: I am long AAPL. I wrote this article myself, and it expresses my own opinions. I am not receiving compensation for it (other than from Seeking Alpha). I have no business relationship with any company whose stock is mentioned in this article.
Additional disclosure: I may trade any of the stocks/ETFs mentioned in the article at any time, including in the next 72 hours.
Anna Kendrick Sandy Hook conspiracy Stuart Scott Holly Rowe Chief Keef FRANK ZAMBONI Tiffany Six
No comments:
Post a Comment